The Quiet Disconnect: How WebSocket Infrastructure Failures Destroy Real-Time Experiences While Your Dashboards Stay Green
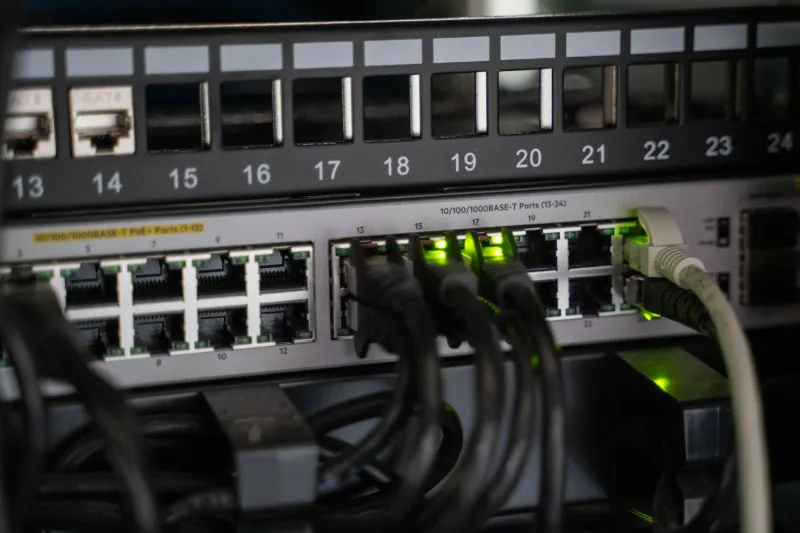
There is a particular kind of infrastructure failure that never appears on a status page. No alert fires. No on-call engineer gets paged. No error rate climbs on the monitoring dashboard. And yet, somewhere across your user base, dozens — perhaps hundreds — of people are sitting in front of your application watching a chat window that stopped updating, a collaborative document that no longer reflects their colleague's edits, or a live data feed frozen at a timestamp from several minutes ago.
This is the WebSocket graveyard: a silent accumulation of broken long-lived connections that your infrastructure has abandoned without telling anyone, least of all the users still waiting for data that will never arrive.
Why WebSockets Break the Monitoring Model
Most infrastructure monitoring tools were designed around a request-response paradigm. An HTTP request goes out, a response comes back, and the transaction is complete. Latency, error rates, and throughput are easy to measure because each interaction has a clear beginning and end.
WebSockets operate on an entirely different contract. When a client establishes a WebSocket connection, both parties agree to maintain an open channel for the duration of a session — potentially minutes or hours. There is no natural endpoint to measure against. No response code to log. No timeout that triggers automatically.
This architectural difference creates a monitoring blind spot that catches mid-market engineering teams off guard. Your observability stack may confirm that new WebSocket handshakes are succeeding at a healthy rate, but that metric tells you nothing about the state of connections established twenty minutes ago. A connection can be technically open at the TCP layer while being functionally dead — unable to pass application-level messages — and most monitoring configurations will never surface that distinction.
The Infrastructure Conditions That Enable Silent Failure
Several specific infrastructure configurations make silent WebSocket disconnections not just possible but likely at scale.
Load balancer timeout misalignment is among the most common culprits. Many load balancers, particularly those configured primarily for HTTP traffic, carry default idle timeout settings measured in seconds or low minutes. A WebSocket connection that goes quiet during a natural lull in user activity — no messages exchanged, no data pushed — can appear idle to the load balancer even when both the client and the application server consider it fully active. When the load balancer quietly terminates that connection, neither endpoint receives a clean close frame. The client believes it is still connected. The server may or may not realize the connection is gone. The user simply stops receiving updates.
Proxy and reverse proxy configurations introduce a second layer of risk. When WebSocket traffic passes through an intermediary like Nginx or HAProxy — as it does in virtually every production architecture — each hop carries its own timeout parameters. Misconfigured intermediaries may strip the Upgrade header required for WebSocket handshakes, silently downgrading connections to HTTP polling without informing the application layer. Others may buffer traffic in ways that introduce latency inconsistent with real-time use cases, or terminate connections that exceed their own internal limits.
Connection pool exhaustion creates a third failure mode that monitoring systems routinely miss. Application servers maintain a finite pool of WebSocket connections. Under sustained load, that pool can fill. New connection attempts may be silently queued or rejected in ways that appear as slow page loads rather than explicit errors. Meanwhile, existing connections that should have been cleaned up — belonging to users who navigated away, closed browser tabs, or lost network access — linger in a half-open state, consuming pool capacity and contributing nothing.
The Compounding Effect on User Experience
What makes WebSocket failures particularly damaging for mid-market businesses is the user experience they produce. Unlike a 500 error, which is immediately recognizable as a failure, a dead WebSocket presents as stasis. The application loads. The interface renders. Everything looks operational. The user simply waits.
For a SaaS platform where real-time collaboration is a core value proposition, that waiting is experienced as product failure. For a financial services dashboard where live data feeds inform decisions, stale information is not a minor inconvenience — it is a liability. For an e-commerce platform with live inventory notifications, a frozen counter can drive purchase decisions based on inaccurate data.
In each scenario, the user's conclusion is the same: the product does not work. And because the failure mode is invisible to your monitoring stack, your team may never connect the spike in support tickets or the uptick in churn to the infrastructure event that caused it.
Detection Strategies That Actually Surface Silent Failures
Closing the monitoring gap around WebSocket connections requires moving beyond infrastructure-level metrics toward application-aware observability.
Heartbeat instrumentation at the application layer is the most reliable detection mechanism available. By configuring both the server and client to exchange lightweight ping-pong frames at regular intervals — every thirty to sixty seconds is a common starting point — you create an active signal that distinguishes a live connection from a silent one. When the application server stops receiving heartbeat responses from a client, it can log that event, update a connection health metric, and proactively close and re-establish the connection rather than leaving it in an ambiguous state.
Connection lifecycle event logging should capture not just new connections but disconnections, including the reason code where available. WebSocket close frames carry status codes that distinguish clean shutdowns from abnormal terminations. Tracking the ratio of clean to abnormal disconnections over time provides a leading indicator of infrastructure stress that aggregate uptime metrics will never reveal.
Synthetic monitoring with persistent sessions extends the principle of active probing to the WebSocket layer. Rather than simply verifying that your endpoint accepts new connections, a synthetic monitor should establish a connection, maintain it for a duration representative of your typical user session, and verify that messages continue to flow throughout. Any synthetic session that drops without a clean close frame warrants investigation.
Correlation between WebSocket health and business metrics closes the loop between infrastructure performance and user impact. If your product includes real-time features, establish a baseline relationship between connection stability metrics and engagement indicators — message delivery rates, session duration, feature utilization. Anomalies in the infrastructure data that precede or accompany drops in those business metrics confirm that your WebSocket layer is the source of user-facing degradation.
Infrastructure Configuration Changes Worth Prioritizing
Detection is necessary but not sufficient. Several configuration changes materially reduce the frequency of silent disconnections.
Load balancer idle timeouts should be extended significantly beyond their HTTP defaults — values in the range of one to several hours are appropriate for applications with long user sessions. Many cloud load balancers in common use among US-based businesses carry defaults far below what WebSocket-heavy applications require, and adjusting this single parameter resolves a substantial share of silent disconnection incidents.
Reverse proxy configurations should explicitly enable WebSocket proxying, preserving the Upgrade and Connection headers required for successful handshakes. Application servers should be configured to send WebSocket ping frames proactively, rather than relying on clients to initiate keep-alive behavior.
Connection pool limits should be monitored continuously, with alerts configured at meaningful thresholds rather than only at exhaustion. A pool operating at eighty percent capacity is a warning condition worth investigating before it becomes a failure condition affecting users.
Visibility as a Prerequisite for Reliability
The WebSocket graveyard exists not because the underlying technology is unreliable, but because the infrastructure practices and observability tooling developed for stateless HTTP traffic transfer poorly to long-lived connections. Mid-market companies building real-time features into their products are, in many cases, operating with monitoring architectures that were never designed to see this class of failure.
Bridging that gap requires deliberate investment in application-layer instrumentation, configuration audits specific to WebSocket traffic, and the organizational discipline to connect infrastructure metrics to the user experiences they ultimately determine. The connections your users depend on deserve the same visibility as every other component in your stack — and the cost of ignoring them is paid quietly, one abandoned session at a time.